
During a PIP test, the generated indent shape is measured using a contacting stylus profilometer. This measures the indent profile as a line-scan from a far-field zero value, through the indent centre and out to a far-field zero on the opposite side of the indent. During profilometry, this measurement is repeated in four directions, each rotated by 45°.
Comparing the shapes of these four scans allows characterisation of any in-plane anisotropy in the tested material. For a material with no in-plane anisotropy, there will be no difference in the profile scan in any scan direction. For materials with in-plane plastic anisotropy, the measured profile shape will differ depending on the scan direction. The observed differences will be in the shape and height of the pile up region (the highest point of the profile around the indent edge). It is possible to infer which direction is softer or harder from an indent by comparing the pile up heights of scans in different directions (a lower pile up height indicates a harder direction). In some cases, the pile up height for two orthogonal scans can be greater than both of their neighbouring scans (fourfold anisotropy), as seen in Figure 1. It is not currently possible to derive the stress-strain properties in each of the differing directions, however work towards achieving this is ongoing.
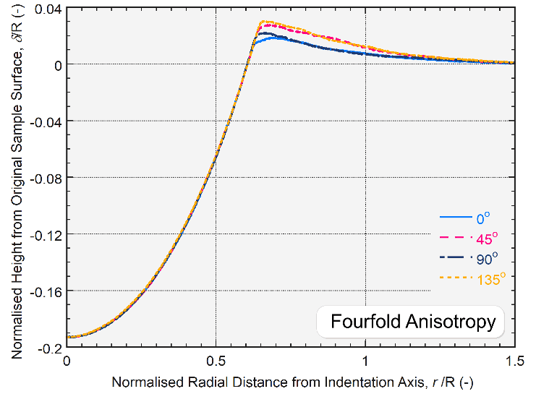
Figure 1: Indent profiles for a material showing fourfold anisotropy.
Within the CORSICA software, the degree of anisotropy derived from an indent is automatically detected. The anisotropy is categorised within one of three levels when reporting the results: no anisotropy, intermediate anisotropy, and severe anisotropy:
- When all the measured profiles sit on top of each other, as seen in Figure 2(a), no in-plane anisotropy is detected, and no warning is flagged to the user, and a direction-averaged profile is generated by taking an average of the X, XY, Y and YX scans. This averaged profile is then used for subsequent inverse FE analysis to generate a stress-strain curve. An example of no anisotropy and a direction-averaged profile is shown in Figure 2(a).
- The intermediate anisotropy warning is flagged to the user with a yellow warning when the difference in pile up heights is within an intermediate range, determined by the software. A direction-averaged profile is again generated by taking an average of the X, XY, Y and YX scans. This averaged profile is then used for subsequent inverse FE analysis to generate a stress-strain curve. An example of intermediate anisotropy and a direction-averaged profile is shown in Figure 2(b).
- Severe anisotropy and a red warning are flagged to the user when the difference in pile up heights in different scan directions exceeds a threshold value, also determined by the software. In these cases, the anisotropy is too severe for an accurate stress-strain curve to be derived, and no results is output to the user. An example of this is shown in Figure 2(c).
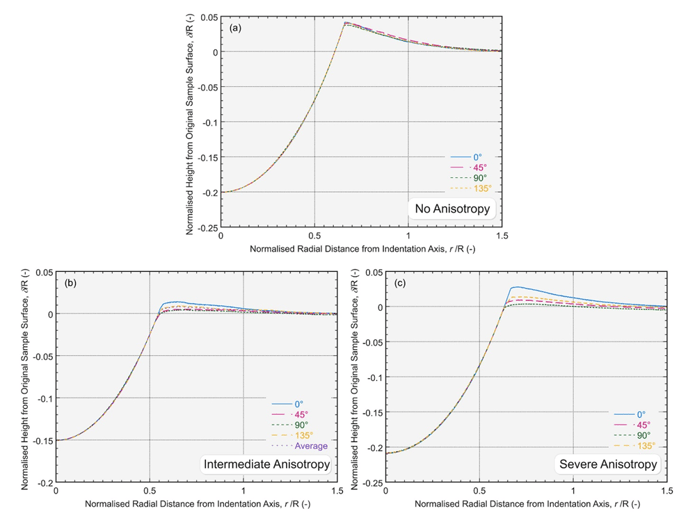
Figure 2: Indent profiles for materials showing (a) no anisotropy, (b) intermediate anisotropy and (c) severe anisotropy.