
Once the machine setup and calibration are complete, the PLX-Benchtop is ready for use. Its primary function is to perform a PIP test, which involves indenting the sample and capturing the residual profile to generate a stress-strain curve. The indentation process and subsequent profilometry are controlled by the CORSICA software, which then uses inverse finite element (FE) analysis to derive the material’s plasticity parameters.
Follow these steps to perform a PIP test:
1. Place the sample within the test space on the platen with the minimal free space around the indenter as per minimal sample dimensions instructions. If you cannot fit the LVDT and indenter on the sample according to these guides, you might need to mount the sample.
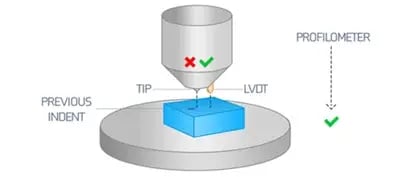
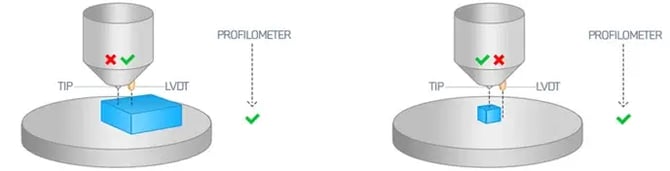
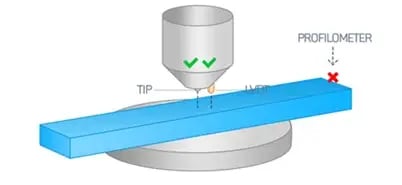
2. Click the ▶️start button located in Test Control. Input file name, directory, and material type. At this point, an optional Brinell test can also be included. Once this is done, click Start.
3. The indenter housing moves downward until the LVDT touches the sample The machine will pause and a dialogue box will appear, allowing the user to manually move the sample in the (x-y) plane until the indenter is above a suitable flat location. This is a final chance to adjust the indent location. Do not indent too close to a free edge or another indent.
4. A safety dialogue box will appear. Ensure that the testing area is clear and confirm when ready to continue.
5. The indenter housing moves slowly downwards and indentation starts. The load-displacement plot is progressively created during loading.
6. The sample is unloaded and the indenter housing is retracted above the sample.
7. The profilometer moves across to the (x, y) location of the indentation axis.
8. A quick search for the precise indent centre is carried out. The profilometer scans the indent in x, y, xy and yx directions.
9. After completion of all the scans, the profilometer returns to its parked location.
10. The Test Diagnostics window provides information pertaining to the test that was just carried out. Warnings are highlighted in yellow and errors are highlighted in red. An option to move on to Data Analysis is presented - click “Transfer to Data Analysis” when ready.