
With the HotPIP module setup and calibrations complete, the machine is ready to use. The primary functionality of HotStage CORSICA - Data Capture is the production of an indent at high temperature (up to 800°C) and the capture of the residual profile.
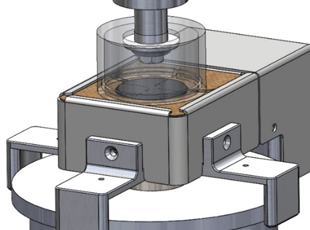
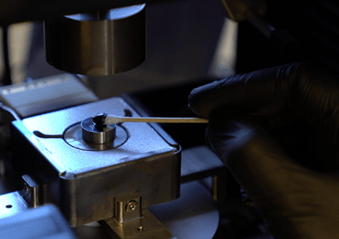
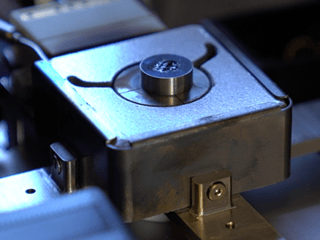
1. Place the sample within the test space on the platen.
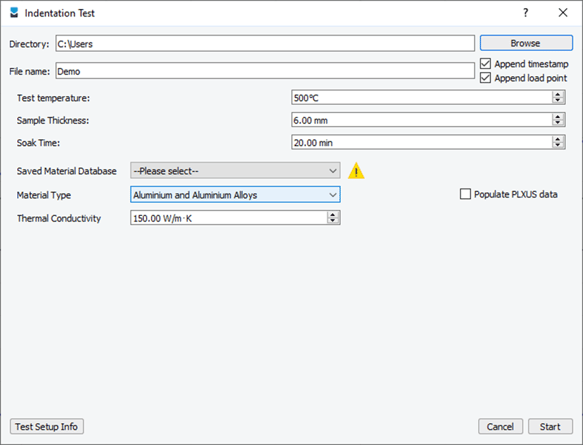
 button located in Test Control. A dialogue box appears, within which the user inputs the following:
-
- File name and directory.
- Test temperature.
- Sample thickness.
- Soak time.
- Material type.
- Thermal conductivity - a default thermal conductivity is assigned depending on the chosen material type, but the user can specify their own.
- Option to populate the PLXUS data for the sample.
Once this has been done, click the ‘Start’ button.
4. A safety dialogue box appears. Ensure that the testing area is clear and confirm when ready to continue. Hands should now not enter the workspace/furnace area until step 11 of this instruction.
5. The indenter housing moves downward until the indenter touches the sample surface.
6. The fans turn on and the heating up phase starts. The calculated sample temperature can be monitored in the ‘Temperature Plot’ tab.
7. Once the desired temperature is reached, the temperature is held constant for the specified soak time.
8. When the soak time is met, the indenter housing moves slowly downwards (after balancing the load cell to account for the small load cell drift), and indentation starts. Typically, it will take about 30 seconds. Indentation continues until the penetration reaches approximately 100 µm (a “penetration ratio”, δ/R, of about 10%). Loading stops at a selected load soon after this point.
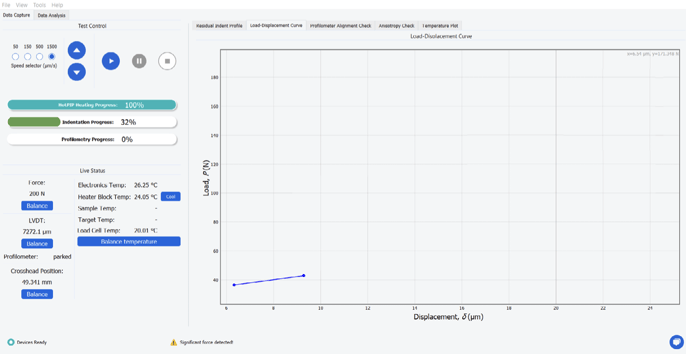
9. The sample is unloaded, and the indenter housing is retracted 6 mm above the sample platform (leaving a small gap to cool the sample, but such that the sample cannot be touched).
10. A safety dialogue box appears, warning the user to not touch the sample until it is below safe temperature (45°C).
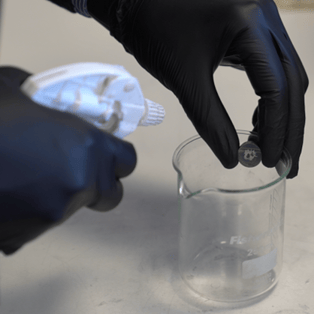
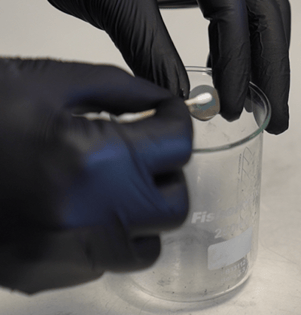
11. When the sample is safe to touch, the indenter housing is retracted well above the sample and the fans turn off. Then, another dialogue box appears asking the user to remove the sample from the platen, clean it using an alcohol-based cleaning solvent such as IPA and a cotton bud, and place it back in the same (approximated) location where it was. Press ‘OK’ to continue.
12. The profilometer moves quickly across to the (x, y) location of the indentation axis.
13. A dialogue box now appears, for positioning of the (x, y) location of the profilometer so that it can scan the indent. This is done via the x- and y-direction arrows within the dialogue box. The profilometer tip should be positioned such that it is aligned with the centre of the indent in the x direction. This should be checked visually, looking through the workspace, as shown in Figure 8. When this is lined up close to the centre, use the y control to do the same in the y direction – this is less crucial in terms of getting close to the indent, but one should try to get as close as possible. When this is completed, click ‘Yes’.
14. The profilometer will touch down on the sample surface. A quick search for the precise indent centre is carried out. The profilometer scans the indent. After completion of the scan, the resultant profile is displayed on the screen. An orthogonal scan is then carried out to check for the presence of anisotropy - see anisotropy check plot.
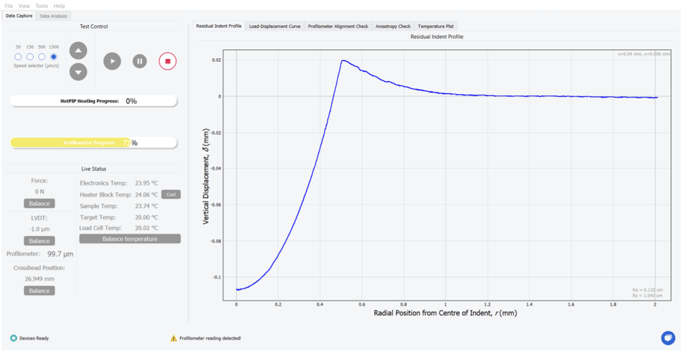
15. Following the x and y-scans, xy and yx scans will be carried out. This is done to attempt to further identify in-plane anisotropy in the sample. Further information can be found post-test in the Test Diagnostics panel. This will include a warning if anisotropy is detected.
16. The profilometer returns quickly to its parked location.
17. The Test Diagnostics are presented. Here you will find information pertaining to the test that was just carried out. The user should consult the Test Diagnostics for warnings – highlighted yellow. An option to move on to Data Analysis is presented - click ‘Transfer to Data Analysis’ when ready.